Ethereum has registered some decline recently as on-chain data shows an elevated amount of deposits towards centralized exchanges.
Ethereum Exchange Deposits Have Spiked Recently
On analista batek adierazi duenez Twitter, there are signs of increased short-term selling pressure in the ETH market at the moment. The relevant indicator here is the “Ethereum active deposits,” which measures the daily total number of exchange addresses that are taking part in some deposit activity currently.
This indicator only keeps track of the unique number of such addresses, meaning that it only counts an address once even if it has been involved in multiple deposit transactions in a single day.
The advantage of this limitation is that unique addresses are analogous to unique users on the network, so this metric can tell us about the number of users making deposits to these platforms.
When the value of this indicator is high, it means a large number of exchange addresses are observing deposits right now. This suggests that a high amount of users are transferring their coins to these platforms currently.

Since one of the main reasons why holders move their coins to the exchanges is for dumping-related purposes, a high value of this metric can be a sign of a mass selloff in the market.
Now, here is a chart that shows the trend in the Ethereum active deposits over the last few months:
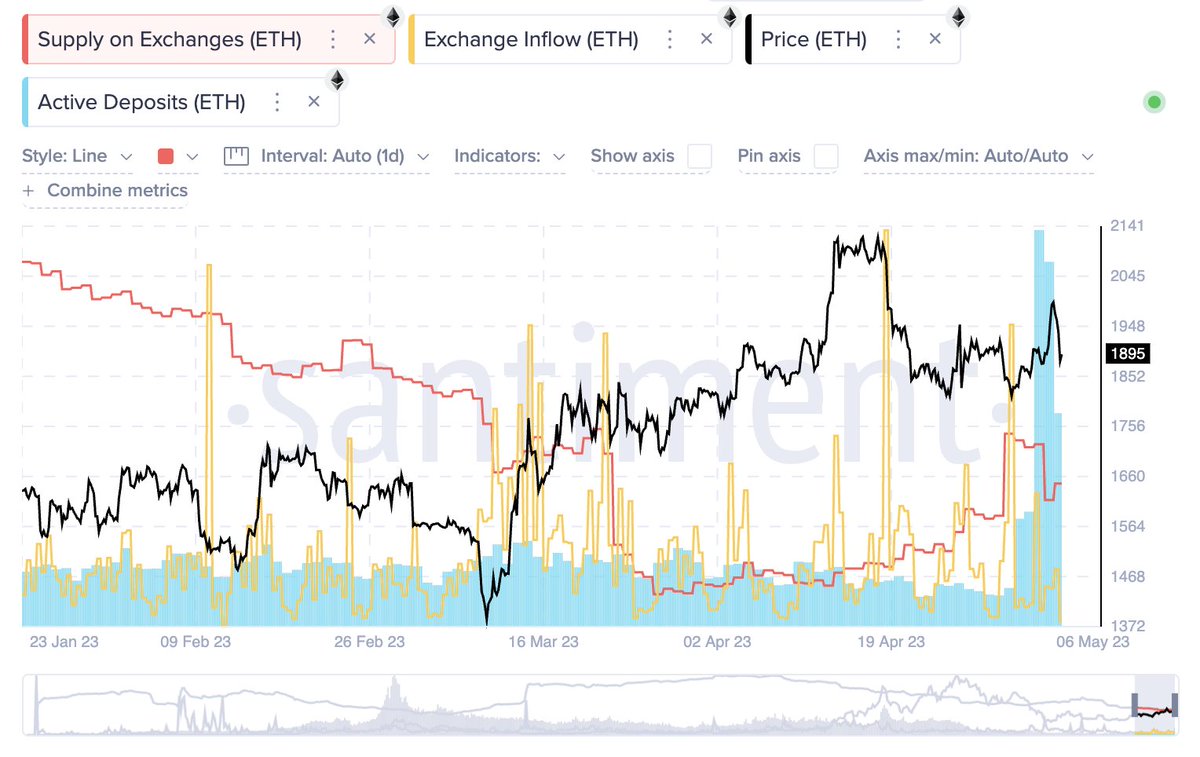
Badirudi metrikaren balioa nahiko altua izan dela azken egunetan | Iturria: Ali Twitterren
As shown in the above graph, the Ethereum active deposits metric surged to some pretty high values during the weekend. At the peak of this spike in the indicator, there were more than 20,000 exchange addresses that were taking part in deposit activity.
These latest values in the indicator have been significantly more than the norm for the year 2023 so far, implying that a much higher amount of users have been making deposits recently.
The recent peak value has in fact also been the highest that the Ethereum active deposits indicator has been since November 2021, the month when ETH set its all-time high price.
In the chart, data for two other metrics, the supply on exchanges and the exchange inflow, is also displayed. The former of these measures the total amount of ETH sitting in the wallets of all exchanges, while the latter tracks the number of coins being deposited into these platforms.
It looks like while there have been a large number of users making deposits recently, there has only been a small exchange inflow spike. This would imply that most of the deposits made haven’t actually involved a transfer of any appreciable amount of ETH, suggesting that the inflows have mainly been coming from retail investors.
The supply on exchanges likewise hasn’t increased after these deposits; it has rather gone down, implying that there have been much stronger withdrawals recently.
Ethereum, however, still seems to have observed a bearish effect from these mass deposits, as its price has fallen below the $1,900 level. Given the scale of the deposits, though, it’s possible that this selling pressure was only short-term, and thus, the drawdown may not go on for too long.
ETH Prezioa
Idazteko unean, Ethereum 1,800 dolar inguru negoziatzen ari da, azken astean % 2 gutxiago.
ETH has gone down during the past day | Source: ETHUSD on TradingView
Kanchanara-ren irudi aipagarria Unsplash.com-en, TradingView.com-en, Santiment.net-en grafikoak
Source: https://bitcoinist.com/ethereum-declines-exchange-deposits-nov-2021-levels/